
Some of you may have experienced this problem in Reports before: you wanted to make a chart to compare the behavior of people with tag A and people with tag B, but you couldn't make a chart with just these 2 tags visible.
I'm happy to say that now you can! In Reports, you can now compare the engagement among members with just your selected tags.
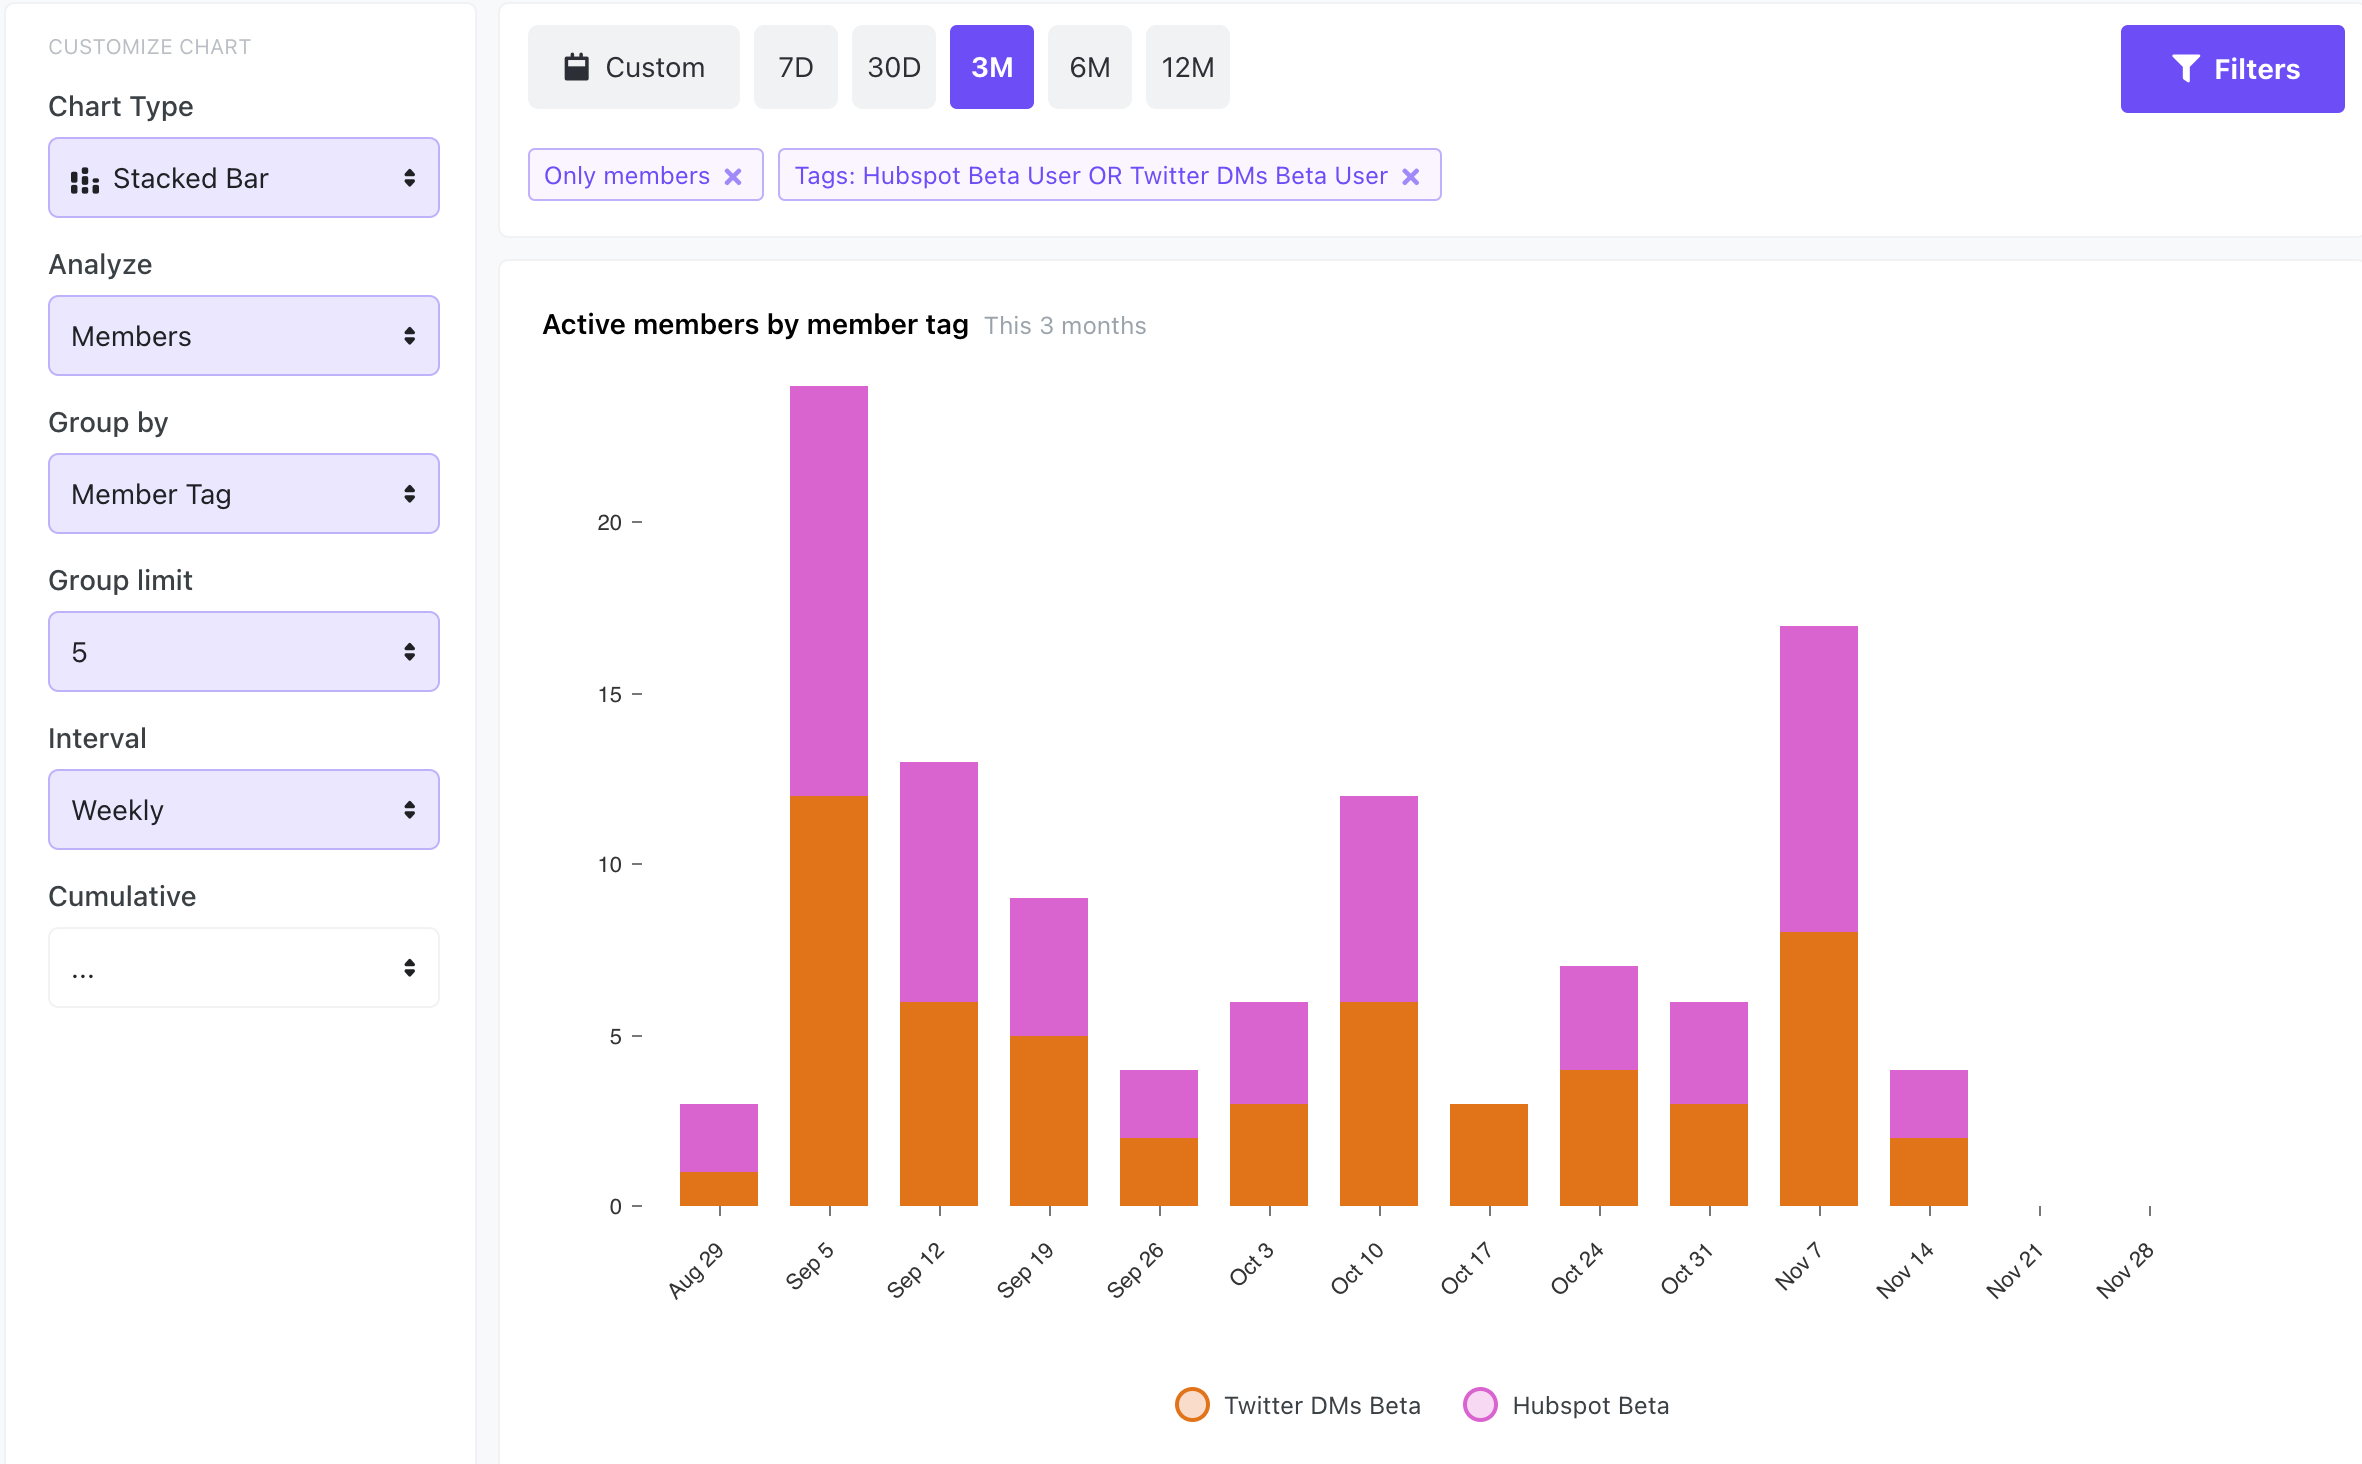
Here is an example of a chart you can now make:
Happy chart building!